


On the back of one of the major FII selloffs seen in recent times, the markets succumbed to strong corrective pressure through the week and ended on a very weak note. The Nifty 50 remained under selling pressure; at no point in time did it show any intention to stage a technical pullback. While the weakness persisted in all five trading sessions, the trading range also got wider, with the Nifty oscillating in an 1167-point range over the past five days. There was a resultant rise in the volatility as well; the IndiaVIX surged by 18.10% to 14.13 on a week-on-week basis. The benchmark Nifty 50 closed with a deep weekly cut of 1164.35 points (-4.45%).
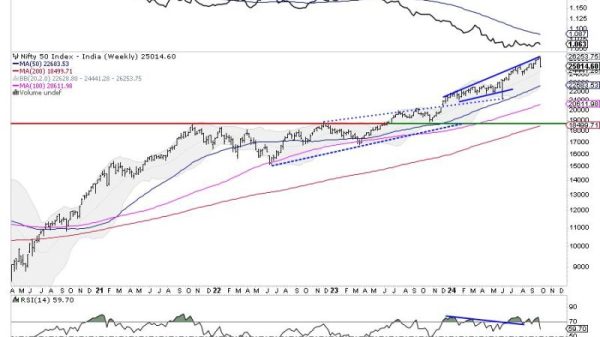
We have evident reasons, like the money flowing out of the Indian markets to the Chinese markets, geopolitical tensions in the Middle East, and SEBI announcing changes in the derivatives trading landscape, to write about when we talk and assign reasons for market declines. However, we also need to take a deeper look at the technical perspective. The Nifty was highly deviated from its mean; at one point in time, the index was trading almost 10% above its 50-week MA. So even the slightest reversion could have seen violent retracements from higher levels. Despite the kind of fall we have seen over the past few days, the Nifty has not even tested the nearest 20-Week MA, which currently stands at 24441. This speaks a lot about the extent to which the markets had run up much ahead of their curve.
The derivatives data suggest that the market may attempt to find support at the 25,000 level. Besides being a psychologically important level, 25,000 strikes not only hold the highest PUT OI as of now, but has a very negligible existence of Call OI. So, even if we continue with an overall downtrend, some minor technical rebound from the current level cannot be ruled out. By and large, a stable start is expected for the week, and the levels of 25300 and 25450 shall act as resistance. The supports are expected to come in at 24910 and 24600.
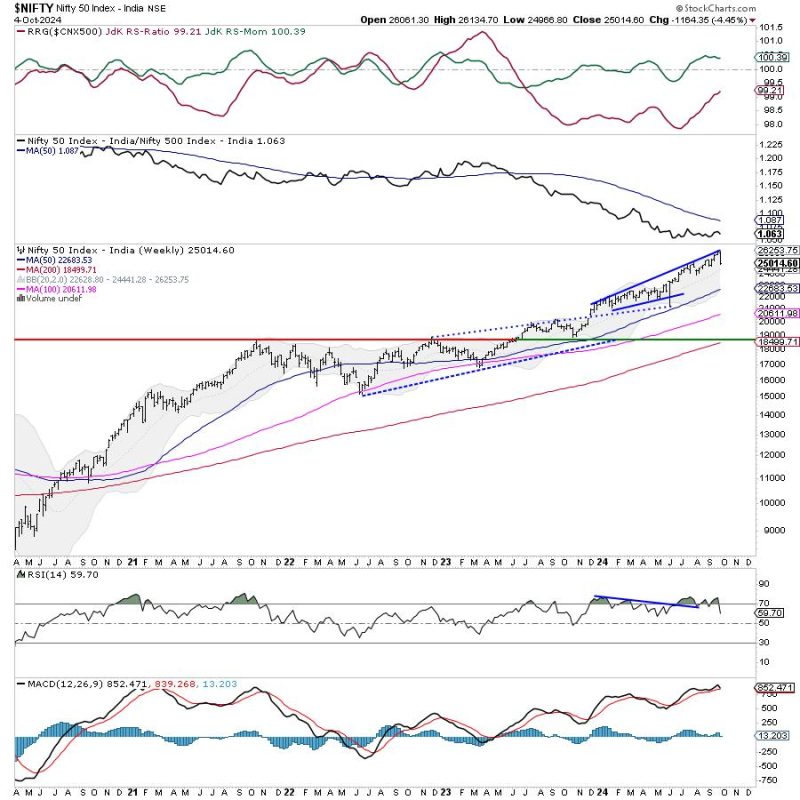
The weekly RSI is 59.70; it has crossed under 70 from an overbought zone, which is bearish. It remains neutral and does not show any divergence against the price. The weekly MACD looks like it’s being on the verge of a negative crossover, as evidenced by a narrowing Histogram. A large bearish candle that emerged hints at the kind of strong selling pressure that was witnessed throughout the week.
The pattern analysis shows that despite the kind of decline that we have seen, the primary trend is still intact. On the daily chart, we have tested the 50-DMA; on the weekly chart, we have not even tested the nearest 20-Week MA. So long as we are above the 24000-24400 zone, there is little chance of the primary uptrend getting disrupted.
All in all, from a short-term technical lens, the behavior of Nifty vis-à-vis the levels of 25000 would be very crucial to watch. If the Nifty has to find some ground and put a base for itself in place, it will have to keep its head above the 25000 level. Any violation of this level on a closing basis would invite more weakness for the index. Then, the levels of 20-week MA may get tested over the coming days. While navigating this turbulent phase, it is recommended that we cut down on highly leveraged positions and stay invested in low-beta defensive pockets. Though it’s important to stay mindful when managing risks, a highly cautious approach is advised for the coming week.
Sector Analysis for the Coming Week
In our look at Relative Rotation Graphs®, we compared various sectors against CNX500 (NIFTY 500 Index), which represents over 95% of the free float market cap of all the stocks listed.
Relative Rotation Graphs (RRG) show Nifty IT, Pharma, Consumption, Services Sector, and FMCG indices are inside the leading quadrant. However, a couple of them are showing some paring of their relative momentum. However, broadly speaking, these groups may show some resilience and may relatively outperform the broader markets.
The Nifty Midcap 100 Index has rolled inside the weakening quadrant. Besides this, the Nifty Auto is also inside the weakening quadrant and can be seen rolling towards the lagging quadrant.
The Nifty PSE Index has rolled inside the lagging quadrant. Along with the Infrastructure Index which is also inside the lagging quadrant, it is set to relatively underperform the broader markets. The Nifty Bank, Energy, Realty, Metal, PSU Bank, Financial Services, and Commodities Index are also inside the lagging quadrant. However, they all are seen improving their relative momentum against the broader Nifty 500 index.
The Nifty Media Index is the only one inside the improving quadrant; however, it is seen rapidly giving up on its relative momentum against the broader markets.
Important Note: RRG charts show the relative strength and momentum of a group of stocks. In the above Chart, they show relative performance against NIFTY500 Index (Broader Markets) and should not be used directly as buy or sell signals.
Milan Vaishnav, CMT, MSTA
Consulting Technical Analyst